Civil Rights
Movements, leaders, victories and the continuing fight for equality.

Explore the people, places, events, achievements, struggles and stories that shaped our journey.
Movements, leaders, victories and the continuing fight for equality.
Innovation, patents, science, technology and world-changing contributions.
Pioneers, champions, Negro Leagues, records, activism and excellence.
Meet the people whose lives, choices and achievements shaped the journey.
Black towns, communities, institutions and places where history happened.
Moments that changed communities, movements, institutions and the nation.
In August 1908, a white mob attacked Springfield, Illinois’s Black community, destroying homes and businesses and lynching two Black men. National outrage over the violence helped spur the movement that created the NAACP the following year.
MORE →Reflects the personal views, recollections, and perspective of the author, Mike Davis.
This is a personal recollection on the Move fire on May 13, 1985
![Warming contributions of various GHGs, agents, factors [name the year that the contributions pertain to] [*correct reference given under the 'Talk' tab*]. Plus, the figure is inaccurate; at least wrt. to methane.](viewer.php?source=wikipedia&q=File%3APhysical%20Drivers%20of%20climate%20change.svg&result=0#selected-result)
Radiative forcing (or climate forcing[2]) is a concept used to quantify a change to the balance of energy flowing through a planetary atmosphere. Various factors contribute to this change in energy balance, such as concentrations of greenhouse gases and aerosols, and changes in surface albedo and solar irradiance. In more technical terms, it is defined as "the change in the net, downward minus upward, radiative flux (expressed in W/m2) due to a change in an external driver of climate change."[3]: 2245 These external drivers are distinguished from feedbacks and variability that are internal to the climate system, and that further influence the direction and magnitude of imbalance. Radiative forcing on Earth is meaningfully evaluated at the tropopause and at the stratopause. It is quantified in units of watts per square meter, and often summarized as an average over the total surface area of the globe.
A planet in radiative equilibrium with its parent star and the rest of space can be characterized by net zero radiative forcing and by a planetary equilibrium temperature.[4]
Radiative forcing is not a thing in the sense that a single instrument can independently measure it. Rather it is a scientific concept and entity whose strength can be estimated from more fundamental physics principles. Scientists use measurements of changes in atmospheric parameters to calculate the radiative forcing.[5]: 1–4
The IPCC summarized the current scientific consensus about radiative forcing changes as follows: "Human-caused radiative forcing of 2.72 W/m2 in 2019 relative to 1750 has warmed the climate system. This warming is mainly due to increased GHG concentrations, partly reduced by cooling due to increased aerosol concentrations".[1]: 11
The atmospheric burden of greenhouse gases due to human activity has grown especially rapidly during the last several decades (since about year 1950). For carbon dioxide, the 50% increase (C/C0 = 1.5) realized as of year 2020 since 1750 corresponds to a cumulative radiative forcing change (ΔF) of +2.17 W/m2.[6] Assuming no change in the emissions growth path, a doubling of concentrations (C/C0 = 2) within the next several decades would correspond to a cumulative radiative forcing change (ΔF) of +3.71 W/m2.
Radiative forcing can be a useful way to compare the growing warming influence of different anthropogenic greenhouse gases over time. The radiative forcing of long-lived and well-mixed greenhouse gases have been increasing in earth's atmosphere since the industrial revolution.[6] Carbon dioxide has the biggest impact on total forcing, while methane and chlorofluorocarbons (CFCs) play smaller roles as time goes on.[6] The five major greenhouse gases (water vapor, carbon dioxide, methane, nitrous oxide and ozone) account for about 96% of the direct radiative forcing by long-lived greenhouse gas increases since 1750. The remaining 4% is contributed by the 15 minor halogenated gases.
Radiative forcing is defined in the IPCC Sixth Assessment Report as follows: "The change in the net, downward minus upward, radiative flux (expressed in W/m2) due to a change in an external driver of climate change, such as a change in the concentration of carbon dioxide (CO2), the concentration of volcanic aerosols or the output of the Sun."[3]: 2245
There are some different types of radiative forcing as defined in the literature:[3]: 2245
The radiation balance of the Earth (i.e. the balance between absorbed and radiated energy) determines the average global temperature. This balance is also called Earth's energy balance. Changes to this balance occur due to factors such as the intensity of solar energy, reflectivity of clouds or gases, absorption by various greenhouse gases or surfaces and heat emission by various materials. Any such alteration is a radiative forcing, which along with its climate feedbacks, ultimately changes the balance. This happens continuously as sunlight hits the surface of Earth, clouds and aerosols form, the concentrations of atmospheric gases vary and seasons alter the groundcover.
Positive radiative forcing means Earth receives more incoming energy from sunlight than it radiates to space. This net gain of energy will cause global warming. Conversely, negative radiative forcing means that Earth loses more energy to space than it receives from the Sun, which produces cooling (global dimming).
Transport of energy and matter in the Earth-atmosphere system is governed by the principles of equilibrium thermodynamics and more generally non-equilibrium thermodynamics. During the first half of the 20th century, physicists developed a comprehensive description of radiative transfer that they began to apply to stellar and planetary atmospheres in radiative equilibrium. Studies of radiative-convective equilibrium (RCE) followed and matured through the 1960s and 1970s. RCE models began to account for more complex material flows within the energy balance, such as those from a water cycle, and thereby described observations better.
Another application of equilibrium models is that a perturbation in the form of an externally imposed intervention can estimate a change in state. The RCE work distilled this into a forcing-feedback framework for change, and produced climate sensitivity results agreeing with those from GCMs. This conceptual framework asserts that a homogeneous disturbance (effectively imposed onto the top-of-atmosphere energy balance) will be met by slower responses (correlated more or less with changes in a planet's surface temperature) to bring the system to a new equilibrium state. Radiative forcing was a term used to describe these disturbances and gained widespread traction in the literature by the 1980s.[5]: 19–23
The concept of radiative forcing has been evolving from the initial proposal, named nowadays instantaneous radiative forcing (IRF), to other proposals that aim to relate better the radiative imbalance with global warming (global surface mean temperature). For example, researchers explained in 2003 how the adjusted troposphere and stratosphere forcing can be used in general circulation models.[7]
The adjusted radiative forcing, in its different calculation methodologies, estimates the imbalance once the stratosphere temperatures has been modified to achieve a radiative equilibrium in the stratosphere (in the sense of zero radiative heating rates). This new methodology is not estimating any adjustment or feedback that could be produced on the troposphere (in addition to stratospheric temperature adjustments), for that goal another definition, named effective radiative forcing has been introduced.[8] In general the ERF is the recommendation of the CMIP6 radiative forcing analysis [9] although the stratospherically adjusted methodologies are still being applied in those cases where the adjustments and feedbacks on the troposphere are considered not critical, like in the well mixed greenhouse gases and ozone.[10][11] A methodology named radiative kernel approach allows to estimate the climate feedbacks within an offline calculation based on a linear approximation [12]

Radiative forcing is used to quantify the strengths of different natural and man-made drivers of Earth's energy imbalance over time. The detailed physical mechanisms by which these drivers cause the planet to warm or cool are varied. Radiative forcing allows the contribution of any one driver to be compared against others.
Another metric called effective radiative forcing or ERF removes the effect of rapid adjustments (so-called "fast feedbacks") within the atmosphere that are unrelated to longer term surface temperature responses. ERF means that climate change drivers can be placed onto a more level playing field to enable comparison of their effects and a more consistent view of how global surface temperature responds to various types of human forcing.[14]
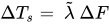
Radiative forcing and climate feedbacks can be used together to estimate a subsequent change in steady-state (often denoted "equilibrium") surface temperature (ΔTs) via the equation:
where commonly denotes the climate sensitivity parameter, usually with units K/(W/m2), and ΔF is the radiative forcing in W/m2.[15] An estimate for is obtained from the inverse of the climate feedback parameter having units (W/m2)/K. An estimated value of gives an increase in global temperature of about 1.6 K above the 1750 reference temperature due to the increase in CO2 over that time (278 to 405 ppm, for a forcing of 2.0 W/m2), and predicts a further warming of 1.4 K above present temperatures if the CO2 mixing ratio in the atmosphere were to become double its pre-industrial value. Both of these calculations assume no other forcings.[16]
Historically, radiative forcing displays the best predictive capacity for specific types of forcing such as greenhouse gases. It is less effective for other anthropogenic influences like soot.[14]
Earth's global radiation balance fluctuates as the planet rotates and orbits the Sun, and as global-scale thermal anomalies arise and dissipate within the terrestrial, oceanic and atmospheric systems (e.g. ENSO).[17] Consequently, the planet's 'instantaneous radiative forcing' (IRF) is also dynamic and naturally fluctuates between states of overall warming and cooling. The combination of periodic and complex processes that give rise to these natural variations will typically revert over periods lasting as long as a few years to produce a net-zero average IRF. Such fluctuations also mask the longer-term (decade-long) forcing trends due to human activities, and thus make direct observation of such trends challenging.[18]

Earth's radiation balance has been continuously monitored by NASA's Clouds and the Earth's Radiant Energy System (CERES) instruments since year 1998.[20][21] Each scan of the globe provides an estimate of the total (all-sky) instantaneous radiation balance. This data record captures both the natural fluctuations and human influences on IRF; including changes in greenhouse gases, aerosols, land surface, etc. The record also includes the lagging radiative responses to the radiative imbalances; occurring mainly by way of Earth system feedbacks in temperature, surface albedo, atmospheric water vapor and clouds.[22][23]
Researchers have used measurements from CERES, AIRS, CloudSat and other satellite-based instruments within NASA's Earth Observing System to parse out contributions by the natural fluctuations and system feedbacks. Removing these contributions within the multi-year data record allows observation of the anthropogenic trend in top-of-atmosphere (TOA) IRF. The data analysis has also been done in a way that is computationally efficient and independent of most related modelling methods and results. Radiative forcing was thus directly observed to have risen by +0.53 W m−2 (±0.11 W m−2) from years 2003 to 2018. About 20% of the increase was associated with a reduction in the atmospheric aerosol burden, and most of the remaining 80% was attributed to the rising burden of greenhouse gases.[18][24][25]
A rising trend in the radiative imbalance due to increasing global CO2 has been previously observed by ground-based instruments. For example, such measurements have been separately gathered under clear-sky conditions at two Atmospheric Radiation Measurement (ARM) sites in Oklahoma and Alaska.[26] Each direct observation found that the associated radiative (infrared) heating experienced by surface dwellers rose by +0.2 W m−2 (±0.07 W m−2) during the decade ending 2010.[27][28] In addition to its focus on longwave radiation and the most influential forcing gas (CO2) only, this result is proportionally less than the TOA forcing due to its buffering by atmospheric absorption.
Radiative forcing can be evaluated for its dependence on different factors which are external to the climate system.[29] Basic estimates summarized in the following sections have been derived (assembled) in accordance with first principles of the physics of matter and energy. Forcings (ΔF) are expressed as changes over the total surface of the planet and over a specified time interval. Estimates may be significant in the context of global climate forcing for times spanning decades or longer.[5] Gas forcing estimates presented in the IPCC's AR6 report have been adjusted to include so-called "fast" feedbacks (positive or negative) which occur via atmospheric responses (i.e. effective radiative forcing).

For a well-mixed greenhouse gas, radiative transfer codes that examine each spectral line for atmospheric conditions can be used to calculate the forcing ΔF as a function of a change in its concentration. These calculations may be simplified into an algebraic formulation that is specific to that gas.

A simplified first-order approximation expression for carbon dioxide (CO2) is:[31]
where C0 is a reference concentration in parts per million (ppm) by volume and ΔC is the concentration change in ppm. For the purpose of some studies (e.g. climate sensitivity), C0 is taken as the concentration prior to substantial anthropogenic changes and has a value of 278 ppm as estimated for the year 1750.
| Baseline concentration, C0 | Concentration change, ΔC | Radiative forcing change, ΔF (W m−2) | |
|---|---|---|---|
| 1979–1989 | 336.8 | +16.0 | +0.248 |
| 1989–1999 | 352.8 | +15.0 | +0.222 |
| 1999–2009 | 367.8 | +18.7 | +0.266 |
| 2009–2019 | 386.5 | +23.6 | +0.316 |
The atmospheric burden of greenhouse gases due to human activity has grown especially rapidly during the last several decades (since about year 1950). For carbon dioxide, the 50% increase (C/C0 = 1.5) realized as of year 2020 since 1750 corresponds to a cumulative radiative forcing change (delta F) of +2.17 W/m2.[6] Assuming no change in the emissions growth path, a doubling of concentrations (C/C0 = 2) within the next several decades would correspond to a cumulative radiative forcing change (delta F) of +3.71 W/m2.
The relationship between CO2 and radiative forcing is logarithmic at concentrations up to around eight times the current value.[32] Constant concentration increases thus have a progressively smaller warming effect. However, the first-order approximation is inaccurate at higher concentrations and there is no saturation in the absorption of infrared radiation by CO2.[33] Various mechanism behind the logarithmic scaling has been proposed but the spectrum distribution of the carbon dioxide seems to be essential,[34] particularly a broadening in the relevant 15-μm band coming from a Fermi resonance present in the molecule.[35][36][37]
Somewhat different formulae apply for other trace greenhouse gases such as methane and N
2O (square-root dependence) or CFCs (linear), with coefficients that may be found for example in the IPCC reports.[38] A 2016 study suggests a significant revision to the methane IPCC formula.[39] Forcings by the most influential trace gases in Earth's atmosphere are included in the section describing recent growth trends, and in the IPCC list of greenhouse gases.
Water vapor is Earth's primary greenhouse gas currently responsible for about half of all atmospheric gas forcing. Its overall atmospheric concentration depends almost entirely on the average planetary temperature, and has the potential to increase by as much as 7% with every degree (°C) of temperature rise (see also: Clausius–Clapeyron relation).[40] Thus over long time scales, water vapor behaves as a system feedback that amplifies the radiative forcing driven by the growth of carbon dioxide and other trace gases.[41][42]
The intensity of solar irradiance including all wavelengths is the Total Solar Irradiance (TSI) and on average is the solar constant. It is equal to about 1361 W m−2 at the distance of Earth's annual-mean orbital radius of one astronomical unit and as measured at the top of the atmosphere.[43] Earth TSI varies with both solar activity and planetary orbital dynamics. Multiple satellite-based instruments including ERB, ACRIM 1-3, VIRGO, and TIM[44][45] have continuously measured TSI with improving accuracy and precision since 1978.[46]
Approximating Earth as a sphere, the cross-sectional area exposed to the Sun () is equal to one quarter the area of the planet's surface (). The globally and annually averaged amount of solar irradiance per square meter of Earth's atmospheric surface () is therefore equal to one quarter of TSI, and has a nearly constant value of .
Earth follows an elliptical orbit around the Sun, so that the TSI received at any instant fluctuates between about 1321 W m−2 (at aphelion in early July) and 1412 W m−2 (at perihelion in early January), and thus by about ±3.4% over each year.[47] This change in irradiance has minor influences on Earth's seasonal weather patterns and its climate zones, which primarily result from the annual cycling in Earth's relative tilt direction.[48] Such repeating cycles contribute a net-zero forcing (by definition) in the context of decades-long climate changes.

Average annual TSI varies between about 1360 W m−2 and 1362 W m−2 (±0.05%) over the course of a typical 11-year sunspot activity cycle.[49] Sunspot observations have been recorded since about year 1600 and show evidence of lengthier oscillations (Gleissberg cycle, Devries/Seuss cycle, etc.) which modulate the 11-year cycle (Schwabe cycle). Despite such complex behavior, the amplitude of the 11-year cycle has been the most prominent variation throughout this long-term observation record.[50]
TSI variations associated with sunspots contribute a small but non-zero net forcing in the context of decadal climate changes.[46] Some research suggests they may have partly influenced climate shifts during the Little Ice Age, along with concurrent changes in volcanic activity and deforestation.[51] Since the late 20th century, average TSI has trended slightly lower along with a downward trend in sunspot activity.[52]
Climate forcing caused by variations in solar irradiance have occurred during Milankovitch cycles, which span periods of about 40,000 to 100,000 years. Milankovitch cycles consist of long-duration cycles in Earth's orbital eccentricity (or ellipticity), cycles in its orbital obliquity (or axial tilt), and precession of its relative tilt direction.[53] Among these, the 100,000 year cycle in eccentricity causes TSI to fluctuate by about ±0.2%.[54] Currently, Earth's eccentricity is nearing its least elliptic (most circular) causing average annual TSI to very slowly decrease.[53] Simulations also indicate that Earth's orbital dynamics will remain stable including these variations for least the next 10 million years.[55]
The Sun has consumed about half its hydrogen fuel since forming approximately 4.5 billion years ago.[56] TSI will continue to slowly increase during the aging process at a rate of about 1% each 100 million years. Such rate of change is far too small to be detectable within measurements and is insignificant on human timescales.
| Δτ | Radiative forcing change ΔF (W m−2) | |
|---|---|---|
| Annual cycle | ±0.034 [47] | 0 (net) |
| Sunspot activity | ±5×10⁻⁴ [49] | ±0.1 [52][57] |
| Orbital shift | −4×10⁻⁷ [54] | −1×10⁻⁴ |
| Sun aging | +1×10⁻⁹ [56] | +2×10⁻⁷ |
The maximum fractional variations (Δτ) in Earth's solar irradiance during the last decade are summarized in the accompanying table. Each variation previously discussed contributes a forcing of:
where R=0.30 is Earth's reflectivity. The radiative and climate forcings arising from changes in the Sun's insolation are expected to continue to be minor, notwithstanding some as-of-yet undiscovered solar physics.[52][58]
 | This article needs to be updated. (April 2024) |
A fraction of incident solar radiation is reflected by clouds and aerosols, oceans and landforms, snow and ice, vegetation, and other natural and man-made surface features. The reflected fraction is known as Earth's bond albedo (R), is evaluated at the top of the atmosphere, and has an average annual global value of about 0.30 (30%). The overall fraction of solar power absorbed by Earth is then (1−R) or 0.70 (70%).[59]
Atmospheric components contribute about three-quarters of Earth albedo, and clouds alone are responsible for half. The major roles of clouds and water vapor are linked with the majority presence of liquid water covering the planet's crust. Global patterns in cloud formation and circulation are highly complex, with couplings to ocean heat flows, and with jet streams assisting their rapid transport. Moreover, the albedos of Earth's northern and southern hemispheres have been observed to be essentially equal (within 0.2%). This is noteworthy since more than two-thirds of land and 85% of the human population are in the north.[60]
Multiple satellite-based instruments including MODIS, VIIRs, and CERES have continuously monitored Earth's albedo since 1998.[61] Landsat imagery, available since 1972, has also been used in some studies.[62] Measurement accuracy has improved and results have converged in recent years, enabling more confident assessment of the recent decadal forcing influence of planetary albedo.[60] Nevertheless, the existing data record is still too short to support longer-term predictions or to address other related questions.
Seasonal variations in planetary albedo can be understood as a set of system feedbacks that occur largely in response to the yearly cycling of Earth's relative tilt direction. Along with the atmospheric responses, most apparent to surface dwellers are the changes in vegetation, snow, and sea-ice coverage. Intra-annual variations of about ±0.02 (± 7%) around Earth's mean albedo have been observed throughout the course of a year, with maxima occurring twice per year near the time of each solar equinox.[60] This repeating cycle contributes net-zero forcing in the context of decades-long climate changes.

Regional albedos change from year to year due to shifts arising from natural processes, human actions, and system feedbacks. For example, human acts of deforestion typically raise Earth's reflectivity while introducing water storage and irrigation to arid lands may lower it. Likewise considering feedbacks, ice loss in arctic regions decreases albedo while expanding desertification at low to middle latitudes increases it.
During years 2000-2012, no overall trend in Earth's albedo was discernible within the 0.1% standard deviation of values measured by CERES.[60] Along with the hemispherical equivalence, some researchers interpret the remarkably small interannual differences as evidence that planetary albedo may currently be constrained by the action of complex system feedbacks. Nevertheless, historical evidence also suggests that infrequent events such as major volcanic eruptions can significantly perturb the planetary albedo for several years or longer.[63]
| Fractional variations (Δα) in Earth's albedo | Radiative forcing change ΔF (W m−2) | |
|---|---|---|
| Annual cycle | ± 0.07[60] | 0 (net) |
| Interannual variation | ± 0.001[60] | ∓ 0.1 |
The measured fractional variations (Δα) in Earth's albedo during the first decade of the 21st century are summarized in the accompanying table. Similar to TSI, the radiative forcing due to a fractional change in planetary albedo (Δα) is:
Satellite observations show that various Earth system feedbacks have stabilized planetary albedo despite recent natural and human-caused shifts.[61] On longer timescales, it is more uncertain whether the net forcing which results from such external changes will remain minor.
The IPCC summarized the current scientific consensus about radiative forcing changes as follows: "Human-caused radiative forcing of 2.72 [1.96 to 3.48] W/m2 in 2019 relative to 1750 has warmed the climate system. This warming is mainly due to increased GHG concentrations, partly reduced by cooling due to increased aerosol concentrations".[1]: 11
Radiative forcing can be a useful way to compare the growing warming influence of different anthropogenic greenhouse gases over time.
The radiative forcing of long-lived and well-mixed greenhouse gases have been increasing in earth's atmosphere since the industrial revolution.[6] The table includes the direct forcing contributions from carbon dioxide (CO2), methane (CH
4), nitrous oxide (N
2O); chlorofluorocarbons (CFCs) 12 and 11;[failed verification] and fifteen other halogenated gases.[66] These data do not include the significant forcing contributions from shorter-lived and less-well-mixed gases or aerosols; including those indirect forcings from the decay of methane and some halogens. They also do not account for changes in land use or solar activity.
Click at right to show/hide table
| |||||||||||||||||||||||||||||||||||||||||||||||||||||||||||||||||||||||||||||||||||||||||||||||||||||||||||||||||||||||||||||||||||||||||||||||||||||||||||||||||||||||||||||||||||||||||||||||||||||||||||||||||||||||||||||||||||||||||||||||||||||||||||||||||||||||||||||||||||||||||||||||||||||||||||||||||||||||||||||||||||||||||||||||||||||||||||||||||||||||||||||||||||||||||||||||||||||||||||||||||||||||||||||||||||||||||||||||||||||||||||||||||||||||||||||||||||||||||||||||||||||||||||||||
|---|---|---|---|---|---|---|---|---|---|---|---|---|---|---|---|---|---|---|---|---|---|---|---|---|---|---|---|---|---|---|---|---|---|---|---|---|---|---|---|---|---|---|---|---|---|---|---|---|---|---|---|---|---|---|---|---|---|---|---|---|---|---|---|---|---|---|---|---|---|---|---|---|---|---|---|---|---|---|---|---|---|---|---|---|---|---|---|---|---|---|---|---|---|---|---|---|---|---|---|---|---|---|---|---|---|---|---|---|---|---|---|---|---|---|---|---|---|---|---|---|---|---|---|---|---|---|---|---|---|---|---|---|---|---|---|---|---|---|---|---|---|---|---|---|---|---|---|---|---|---|---|---|---|---|---|---|---|---|---|---|---|---|---|---|---|---|---|---|---|---|---|---|---|---|---|---|---|---|---|---|---|---|---|---|---|---|---|---|---|---|---|---|---|---|---|---|---|---|---|---|---|---|---|---|---|---|---|---|---|---|---|---|---|---|---|---|---|---|---|---|---|---|---|---|---|---|---|---|---|---|---|---|---|---|---|---|---|---|---|---|---|---|---|---|---|---|---|---|---|---|---|---|---|---|---|---|---|---|---|---|---|---|---|---|---|---|---|---|---|---|---|---|---|---|---|---|---|---|---|---|---|---|---|---|---|---|---|---|---|---|---|---|---|---|---|---|---|---|---|---|---|---|---|---|---|---|---|---|---|---|---|---|---|---|---|---|---|---|---|---|---|---|---|---|---|---|---|---|---|---|---|---|---|---|---|---|---|---|---|---|---|---|---|---|---|---|---|---|---|---|---|---|---|---|---|---|---|---|---|---|---|---|---|---|---|---|---|---|---|---|---|---|---|---|---|---|---|---|---|---|---|---|---|---|---|---|---|---|---|---|---|---|---|---|---|---|---|---|---|---|---|---|---|---|---|---|---|---|---|---|---|---|---|---|---|---|---|---|---|---|---|---|---|---|---|---|---|---|---|---|---|---|---|---|---|---|---|---|---|---|---|---|---|---|---|---|---|---|---|---|---|---|---|---|---|---|---|---|---|---|---|---|---|---|---|---|---|---|---|---|---|---|---|---|---|---|---|---|---|---|---|---|---|---|---|---|---|---|---|---|---|---|---|---|---|
|
|
These data show that CO2 dominates the total forcing, with methane and chlorofluorocarbons (CFC) becoming relatively smaller contributors to the total forcing over time.[6] The five major greenhouse gases account for about 96% of the direct radiative forcing by long-lived greenhouse gas increases since 1750. The remaining 4% is contributed by the 15 minor halogenated gases.
It might be observed that the total forcing for year 2016, 3.027 W m−2, together with the commonly accepted value of climate sensitivity parameter λ, 0.8 K /(W m−2), results in an increase in global temperature of 2.4 K, much greater than the observed increase, about 1.2 K.[67][failed verification] Part of this difference is due to lag in the global temperature achieving steady state with the forcing. The remainder of the difference is due to negative aerosol forcing (compare climate effects of particulates), climate sensitivity being less than the commonly accepted value, or some combination thereof.[68]
The table also includes an "Annual Greenhouse Gas Index" (AGGI), which is defined as the ratio of the total direct radiative forcing due to long-lived greenhouse gases for any year for which adequate global measurements exist to that which was present in 1990.[6] 1990 was chosen because it is the baseline year for the Kyoto Protocol. This index is a measure of the inter-annual changes in conditions that affect carbon dioxide emission and uptake, methane and nitrous oxide sources and sinks, the decline in the atmospheric abundance of ozone-depleting chemicals related to the Montreal Protocol. and the increase in their substitutes (hydrogenated CFCs (HCFCs) and hydrofluorocarbons (HFC). Most of this increase is related to CO2. For 2013, the AGGI was 1.34 (representing an increase in total direct radiative forcing of 34% since 1990). The increase in CO2 forcing alone since 1990 was about 46%. The decline in CFCs considerably tempered the increase in net radiative forcing.
An alternative table prepared for use in climate model intercomparisons conducted under the auspices of IPCC and including all forcings, not just those of greenhouse gases.[69]
{{cite book}}: CS1 maint: location missing publisher (link)
 This article incorporates public domain material from Butler, James H. and Montzka, Steven J. (2022). THE NOAA ANNUAL GREENHOUSE GAS INDEX (AGGI). NOAA/ESRL. Retrieved 7 March 2023.
{{citation}}: CS1 maint: multiple names: authors list (link)
{{cite journal}}: CS1 maint: multiple names: authors list (link)
{{cite journal}}: CS1 maint: multiple names: authors list (link)
{{cite journal}}: CS1 maint: multiple names: authors list (link)
{{cite journal}}: CS1 maint: multiple names: authors list (link)
{{cite journal}}: CS1 maint: multiple names: authors list (link)
{{cite journal}}: CS1 maint: multiple names: authors list (link)
{{cite journal}}: CS1 maint: multiple names: authors list (link)
{{cite journal}}: CS1 maint: multiple names: authors list (link)
{{cite journal}}: CS1 maint: multiple names: authors list (link)
{{cite journal}}: CS1 maint: multiple names: authors list (link)
Source: Wikipedia. Article content is retrieved live through the MediaWiki API.

Radiative forcing (or climate forcing) is a concept used to quantify a change to the balance of energy flowing through a planetary atmosphere. Various factors contribute to this change in energy balance, such as concentrations of greenhouse gases and aerosols, and changes in surface albedo and solar irradiance. In more technical terms, it is defined as "the change in the net, downward minus upward, radiative flux (expressed in W/m2) due to a change in an external driver of climate change." These external drivers are distinguished from feedbacks and variability that are internal to the climate system, and that further influence the direction and magnitude of imbalance. Radiative forcing on Earth is meaningfully evaluated at the tropopause and at the stratopause. It is quantified in units of watts per square meter, and often summarized as an average over the total surface area of the globe. A planet in radiative equilibrium with its parent star and the rest of space can be characterized by net zero radiative forcing and by a planetary equilibrium temperature. Radiative forcing is not a thing in the sense that a single instrument can independently measure it. Rather it is a scientific concept and entity whose strength can be estimated from more fundamental physics principles. Scientists use measurements of changes in atmospheric parameters to calculate the radiative forcing. The IPCC summarized the current scientific consensus about radiative forcing changes as follows: "Human-caused radiative forcing of 2.72 W/m2 in 2019 relative to 1750 has warmed the climate system. This warming is mainly due to increased GHG concentrations, partly reduced by cooling due to increased aerosol concentrations". The atmospheric burden of greenhouse gases due to human activity has grown especially rapidly during the last several decades (since about year 1950). For carbon dioxide, the 50% increase (C/C0 = 1.5) realized as of year 2020 since 1750 corresponds to a cumulative radiative forcing change (ΔF) of +2.17 W/m2. Assuming no change in the emissions growth path, a doubling of concentrations (C/C0 = 2) within the next several decades would correspond to a cumulative radiative forcing change (ΔF) of +3.71 W/m2. Radiative forcing can be a useful way to compare the growing warming influence of different anthropogenic greenhouse gases over time. The radiative forcing of long-lived and well-mixed greenhouse gases have been increasing in earth's atmosphere since the industrial revolution. Carbon dioxide has the biggest impact on total forcing, while methane and chlorofluorocarbons (CFCs) play smaller roles as time goes on. The five major greenhouse gases (water vapor, carbon dioxide, methane, nitrous oxide and ozone) account for about 96% of the direct radiative forcing by long-lived greenhouse gas increases since 1750. The remaining 4% is contributed by the 15 minor halogenated gases.

Life Cycle Climate Performance (LCCP) is an evolving method to evaluate the carbon footprint and global warming impact of heating, ventilation, air conditioning (AC), refrigeration systems, and potentially other applications such as thermal insulating foam. It is calculated as the sum of direct, indirect, and embodied greenhouse gas (GHG) emissions generated over the lifetime of the system "from cradle to grave," i.e. from manufacture to disposal. Direct emissions include all climate forcing effects from the release of refrigerants into the atmosphere, including annual leakage and losses during service and disposal of the unit. Indirect emissions include the climate forcing effects of GHG emissions from the electricity powering the equipment. The embodied emissions include the climate forcing effects of the manufacturing processes, transport, and installation for the refrigerant, materials, and equipment, and for recycle or other disposal of the product at end of its useful life. LCCP is more inclusive than previous metrics such as Total Equivalent Warming Impact (TEWI), which considers direct and indirect GHG emissions but overlooks embodied emissions, and Life Cycle Warming Impact (LCWI), which considers direct, indirect and refrigerant manufacturing emissions but overlooks appliance manufacturing, materials, transport installation and recycle. Enhanced and Localized Life Cycle Climate Performance (EL-LCCP) is the latest and most comprehensive carbon metric and takes into account: 1) real-world operating conditions, including the actual hour-by-hour carbon intensity of electricity generation, transmission, and distribution, which is degraded by high ambient temperature; 2) specific conditions of AC condensers located within urban heat islands and in locations with poor air circulation (mounted to close to buildings, clustered and stacked), as well of refrigerators and refrigerated display cases located against walls, inside cabinets, and other locations that compromise energy efficiency; 3) local climate conditions, such as higher ambient temperature at the location of the equipment than at the weather monitoring stations, which typically are located away from human influence. TEWI was developed by experts at Oak Ridge National Laboratory under contract from Allied Signal (now Honeywell) and was a step forward as a complement and enhancement of previous metrics like coefficient of performance (COP) and Seasonal Energy Efficiency Ratio (SEER), which consider energy use but not global warming potential (GWP) and emissions of refrigerants.

James Edward Hansen (born March 29, 1941) is an American climatologist. He is an adjunct professor directing the Program on Climate Science, Awareness and Solutions at Columbia University. He is best known for his research in climatology, his 1988 Congressional testimony on climate change that helped raise broad awareness of global warming, and his advocacy of action to avoid dangerous climate change. In recent years, he has become a climate activist to mitigate the effects of global warming, on a few occasions leading to his arrest. In 2000, Hansen had proposed an alternative scenario for combating the threat of global warming by focusing on reducing non-CO2 greenhouse gases (GHGs). His estimates of global climate had found that non-CO2 GHGs (such as methane) caused more observed global warming than carbon dioxide. However, he pointed out that CO2 would become the dominant climate forcing, if global emissions continued to rise.

Climate variability includes all the variations in the climate that last longer than individual weather events, whereas the term climate change only refers to those variations that persist for a longer period of time, typically decades or more. Climate change may refer to any time in Earth's history, but the term is now commonly used to describe contemporary climate change, often popularly referred to as global warming. Since the Industrial Revolution, the climate has increasingly been affected by human activities. The climate system receives nearly all of its energy from the sun and radiates energy to outer space. The balance of incoming and outgoing energy and the passage of the energy through the climate system is Earth's energy budget. When the incoming energy is greater than the outgoing energy, Earth's energy budget is positive and the climate system is warming. If more energy goes out, the energy budget is negative and Earth experiences cooling. The energy moving through Earth's climate system finds expression in weather, varying on geographic scales and time. Long-term averages and variability of weather in a region constitute the region's climate. Such changes can be the result of "internal variability", when natural processes inherent to the various parts of the climate system alter the distribution of energy. Examples include variability in ocean basins such as the Pacific decadal oscillation and Atlantic multidecadal oscillation. Climate variability can also result from external forcing, when events outside of the climate system's components produce changes within the system. Examples include changes in solar output and volcanism. Climate variability has consequences for sea level changes, plant life, and mass extinctions; it also affects human societies.
Before the 1921 destruction of Tulsa’s Greenwood District, Black residents had created a remarkable center of business and community life. The district included stores, professional offices, entertainment venues and homes owned by Black citizens. Understanding Greenwood means learning what was built—not only what was burned.
MORE →Madam C.J. Walker