Civil Rights
Movements, leaders, victories and the continuing fight for equality.

Explore the people, places, events, achievements, struggles and stories that shaped our journey.
Movements, leaders, victories and the continuing fight for equality.
Innovation, patents, science, technology and world-changing contributions.
Pioneers, champions, Negro Leagues, records, activism and excellence.
Meet the people whose lives, choices and achievements shaped the journey.
Black towns, communities, institutions and places where history happened.
Moments that changed communities, movements, institutions and the nation.
In August 1908, a white mob attacked Springfield, Illinois’s Black community, destroying homes and businesses and lynching two Black men. National outrage over the violence helped spur the movement that created the NAACP the following year.
MORE →Reflects the personal views, recollections, and perspective of the author, Mike Davis.
This is a personal recollection on the Move fire on May 13, 1985

In geometric modelling and in computer graphics, a composite Bézier curve or Bezier spline is a spline made out of Bézier curves that is at least continuous. In other words, a composite Bézier curve is a series of Bézier curves joined end to end where the last point of one curve coincides with the starting point of the next curve. Depending on the application, additional smoothness requirements (such as or continuity) may be added.[1]
Perhaps the most common use of composite Béziers is to describe the outline of each letter in a PostScript or PDF file. Such outlines are composed of one béziergon for open letters, or multiple béziergons for closed letters. Modern vector graphics and computer font systems like PostScript, Asymptote, Metafont, OpenType, and SVG use composite Bézier curves composed of cubic Bézier curves (3rd order curves) for drawing curved shapes.

A continuous composite Bézier is also called a polybézier, by similarity to polyline, but whereas in polylines the points are connected by straight lines, in a polybézier the points are connected by Bézier curves. A béziergon (also called bézigon) is a closed path composed of Bézier curves. It is similar to a polygon in that it connects a set of vertices by lines, but whereas in polygons the vertices are connected by straight lines, in a béziergon the vertices are connected by Bézier curves.[2][3][4] Some authors even call a composite Bézier curve a "Bézier spline";[5] the latter term is however used by other authors as a synonym for the (non-composite) Bézier curve, and they add "composite" in front of "Bézier spline" to denote the composite case.[6]
A commonly desired property of splines is for them to join their individual curves together with a specified level of parametric or geometric continuity. While individual curves in the spline are fully continuous within their own interval, there is always some amount of discontinuity where different curves meet.
The Bézier spline is fairly unique in that it's one of the few splines that doesn't guarantee any higher degree of continuity than . It is, however, possible to arrange control points to guarantee various levels of continuity across joins, though this can come at a loss of local control if the constraint is too strict for the given degree of the Bézier spline.
Given two cubic Bézier curves with control points and respectively, the constraints for ensuring continuity at can be defined as follows:
While the following continuity constraints are possible, they are rarely used with cubic polybéziers, as other splines like the B-spline or the β-spline[7] will naturally handle higher constraints without loss of local control.
In case circular arc primitives are not supported in a particular environment, they may be approximated by Bézier curves.[9] Commonly, eight quadratic segments[10] or four cubic segments are used to approximate a circle. It is desirable to find the length of control points which result in the least approximation error for a given number of cubic segments.
Considering only the 90-degree unit-circular arc in the first quadrant, we define the endpoints and with control points and , respectively, as:
From the definition of the cubic Bézier curve, we have:
With the point as the midpoint of the arc, we may write the following two equations:
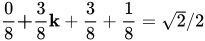
Solving these equations for the x-coordinate (and identically for the y-coordinate) yields:[9]
Note however that the resulting Bézier curve is entirely outside the circle, with a maximum deviation of the radius of about 0.00027. For the rest of the discussion, the radial drift for a given t is .
Unattributed correction:[citation needed] Adding a small correction to intermediate points such as
the magnitude of the radius deviation to 1 is reduced by a factor of about 3, to 0.000068 (at the expense of the derivability of the approximated circle curve at endpoints).
Ellsworth's three-parameter correction: Instead of solving for a single k, solve for Minimize the maximum radial drift, which is . Solving numerically gives a = 1.00005507808, b = 0.55342925736, and c = 0.99873327689. The maximum radial drift is 0.000055.[11]
Ellsworth's least-square correction: Solve for the k that minimizes . Numerically . The maximal radial drift is 0.0002, for a 1.9% reduction in the total squared radial drift compared to the three-parameter case.[12]
We may approximate a unit circle of radius from an arbitrary number of cubic Bézier curves. Let the arc start at point and end at point , placed at equal distances above and below the x-axis, spanning an arc of angle :
After solving for the curve starting and ending at the given points, the arc's midpoint occurring at , and the curve's end point tangents being the same as the circles, the control points may be written as:
Multiplying the values provide general solutions for arcs of any radius. Using rotation matrices allows the drawing of any angle.[13]
The constraints of Ellsworth's solutions can be applied to the general case and numerically solved as well.


For Bézier curves of degree n > 1, Ahn (2019) provide an approximation for any number of segments. The Hausdorff distance as well as the aforementioned "radial drift" show 2n-1 extreme points and Ahn's approximation is, as of the time of publication, the one with the smallest maximum Hausdorff distance. Explicit, analytical solutions are provided for the quadratic, cubic, and quartic cases.[14]
Applying affine transformation to the constraints allows the drawing of ellipses and elliptical arcs.[15]
TrueType fonts use composite Béziers composed of quadratic Bézier curves (2nd order curves) while most PostScript Type 1 and OpenType CFF use cubic (3rd order) curves. To describe a typical type design as a computer font to any given accuracy, 3rd order Béziers require less data than 2nd order Béziers; and these in turn require less data than a series of straight lines. This is true even though any one straight line segment requires less data than any one segment of a parabola; and that parabolic segment in turn requires less data than any one segment of a 3rd order curve.
Source: Wikipedia. Article content is retrieved live through the MediaWiki API.

In geometric modelling and in computer graphics, a composite Bézier curve or Bezier spline is a spline made out of Bézier curves that is at least C 0 {\displaystyle C^{0}} continuous. In other words, a composite Bézier curve is a series of Bézier curves joined end to end where the last point of one curve coincides with the starting point of the next curve. Depending on the application, additional smoothness requirements (such as C 1 {\displaystyle C^{1}} or C 2 {\displaystyle C^{2}} continuity) may be added. Perhaps the most common use of composite Béziers is to describe the outline of each letter in a PostScript or PDF file. Such outlines are composed of one béziergon for open letters, or multiple béziergons for closed letters. Modern vector graphics and computer font systems like PostScript, Asymptote, Metafont, OpenType, and SVG use composite Bézier curves composed of cubic Bézier curves (3rd order curves) for drawing curved shapes.

In mathematics, a projective plane is a geometric structure that extends the concept of a plane. In the ordinary Euclidean plane, two lines typically intersect at a single point, but there are some pairs of lines (namely, parallel lines) that do not intersect. A projective plane can be thought of as an ordinary plane equipped with additional "points at infinity" where parallel lines intersect. Thus any two distinct lines in a projective plane intersect at exactly one point. Renaissance artists, in developing the techniques of drawing in perspective, laid the groundwork for this mathematical topic. The archetypical example is the real projective plane, also known as the extended Euclidean plane. This example, in slightly different guises, is important in algebraic geometry, topology and projective geometry where it may be denoted variously by PG(2, R), RP2, or P2(R), among other notations. There are many other projective planes, both infinite, such as the complex projective plane, and finite, such as the Fano plane. A projective plane is a 2-dimensional projective space. Not all projective planes can be embedded in 3-dimensional projective spaces; such embeddability is a consequence of a property known as Desargues' theorem, not shared by all projective planes.

Vector graphics are a form of computer graphics in which visual images are created directly from geometric shapes defined on a Cartesian plane, such as points, lines, curves and polygons. The associated mechanisms may include vector display and printing hardware, vector data models and file formats, as well as the software based on these data models (especially graphic design software, computer-aided design, and geographic information systems). Vector graphics are an alternative to raster or bitmap graphics, with each having advantages and disadvantages in specific situations. While vector hardware has largely disappeared in favor of raster-based monitors and printers, vector data and software continue to be widely used, especially when a high degree of geometric precision is required, and when complex information can be decomposed into simple geometric primitives. Thus, it is the preferred model for domains such as engineering, architecture, surveying, 3D rendering, and typography, but is entirely inappropriate for applications such as photography and remote sensing, where raster is more effective and efficient. Some application domains, such as geographic information systems (GIS) and graphic design, use both vector and raster graphics at times, depending on purpose. Vector graphics are based on the mathematics of analytic or coordinate geometry, and is not related to other mathematical uses of the term vector. This can lead to some confusion in disciplines in which both meanings are used.

A pyramid (from Ancient Greek πυραμίς (puramís) 'pyramid', from the Egyptian pir-em-us, the vertical height of the structure) is a structure whose visible surfaces are triangular in broad outline and converge toward the top, making the appearance roughly a pyramid in the geometric sense. The base of a pyramid can be of any polygon shape, such as triangular or quadrilateral, and its surface-lines either filled or stepped. A pyramid has the majority of its mass closer to the ground with less mass towards the pyramidion at the apex. This is due to the gradual decrease in the cross-sectional area along the vertical axis with increasing elevation. This offers a weight distribution that allowed early civilizations to create monumental structures.Ancient civilizations in many parts of the world pioneered the building of pyramids. The largest pyramid by volume is the Mesoamerican Great Pyramid of Cholula, in the Mexican state of Puebla. For millennia, the largest structures on Earth were pyramids—first the Red Pyramid in the Dashur Necropolis and then the Great Pyramid of Khufu, both in Egypt. The latter is the only extant example of the Seven Wonders of the Ancient World.
Before the 1921 destruction of Tulsa’s Greenwood District, Black residents had created a remarkable center of business and community life. The district included stores, professional offices, entertainment venues and homes owned by Black citizens. Understanding Greenwood means learning what was built—not only what was burned.
MORE →Shirley Chisholm, elected in 1968.