Civil Rights
Movements, leaders, victories and the continuing fight for equality.

Explore the people, places, events, achievements, struggles and stories that shaped our journey.
Movements, leaders, victories and the continuing fight for equality.
Innovation, patents, science, technology and world-changing contributions.
Pioneers, champions, Negro Leagues, records, activism and excellence.
Meet the people whose lives, choices and achievements shaped the journey.
Black towns, communities, institutions and places where history happened.
Moments that changed communities, movements, institutions and the nation.
In August 1908, a white mob attacked Springfield, Illinois’s Black community, destroying homes and businesses and lynching two Black men. National outrage over the violence helped spur the movement that created the NAACP the following year.
MORE →Reflects the personal views, recollections, and perspective of the author, Mike Davis.
This is a personal recollection on the Move fire on May 13, 1985
| Part of a series on |
| Regression analysis |
|---|
| Models |
| Estimation |
| Background |
In statistics, ordinal regression, also called ordinal classification, is a type of regression analysis used for predicting an ordinal variable, i.e. a variable whose value exists on an arbitrary scale where only the relative ordering between different values is significant. It can be considered an intermediate problem between regression and classification.[1][2] Examples of ordinal regression are ordered logit and ordered probit. Ordinal regression turns up often in the social sciences, for example in the modeling of human levels of preference (on a scale from, say, 1–5 for "very poor" through "excellent"), as well as in information retrieval. In machine learning, ordinal regression may also be called ranking learning.[3][a]
Ordinal regression can be performed using a generalized linear model (GLM) that fits both a coefficient vector and a set of thresholds to a dataset. Suppose one has a set of observations, represented by length-p vectors x1 through xn, with associated responses y1 through yn, where each yi is an ordinal variable on a scale 1, ..., K. For simplicity, and without loss of generality, we assume y is a non-decreasing vector, that is, yi yi+1. To this data, one fits a length-p coefficient vector w and a set of thresholds θ1, ..., θK−1 with the property that θ1 < θ2 < ... < θK−1. This set of thresholds divides the real number line into K disjoint segments, corresponding to the K response levels.
The model can now be formulated as
or, the cumulative probability of the response y being at most i is given by a function σ (the inverse link function) applied to a linear function of x. Several choices exist for σ; the logistic function
gives the ordered logit model, while using the CDF of the standard normal distribution gives the ordered probit model. A third option is to use an exponential function
which gives the proportional hazards model.[4]
The probit version of the above model can be justified by assuming the existence of a real-valued latent variable (unobserved quantity) y*, determined by[5]
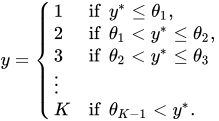
where ε is normally distributed with zero mean and unit variance, conditioned on x. The response variable y results from an "incomplete measurement" of y*, where one only determines the interval into which y* falls:
Defining θ0 = -∞ and θK = ∞, the above can be summarized as y = k if and only if θk−1 < y* ≤ θk.
From these assumptions, one can derive the conditional distribution of y as[5]
where Φ is the cumulative distribution function of the standard normal distribution, and takes on the role of the inverse link function σ. The log-likelihood of the model for a single training example xi, yi can now be stated as[5]
(using the Iverson bracket [yi = k].) The log-likelihood of the ordered logit model is analogous, using the logistic function instead of Φ.[6]
In machine learning, alternatives to the latent-variable models of ordinal regression have been proposed. An early result was PRank, a variant of the perceptron algorithm that found multiple parallel hyperplanes separating the various ranks; its output is a weight vector w and a sorted vector of K−1 thresholds θ, as in the ordered logit/probit models. The prediction rule for this model is to output the smallest rank k such that wx < θk.[7]
Other methods rely on the principle of large-margin learning that also underlies support vector machines.[8][9]
Another approach is given by Rennie and Srebro, who, realizing that "even just evaluating the likelihood of a predictor is not straight-forward" in the ordered logit and ordered probit models, propose fitting ordinal regression models by adapting common loss functions from classification (such as the hinge loss and log loss) to the ordinal case.[10]
ORCA (Ordinal Regression and Classification Algorithms) is an Octave/MATLAB framework including a wide set of ordinal regression methods.[11]
R packages that provide ordinal regression methods include MASS[12], Rstan, brms and Ordinal.[13]
{{cite book}}: CS1 maint: publisher location (link)Source: Wikipedia. Article content is retrieved live through the MediaWiki API.
In statistics, ordinal regression, also called ordinal classification, is a type of regression analysis used for predicting an ordinal variable, i.e. a variable whose value exists on an arbitrary scale where only the relative ordering between different values is significant. It can be considered an intermediate problem between regression and classification. Examples of ordinal regression are ordered logit and ordered probit. Ordinal regression turns up often in the social sciences, for example in the modeling of human levels of preference (on a scale from, say, 1–5 for "very poor" through "excellent"), as well as in information retrieval. In machine learning, ordinal regression may also be called ranking learning.

Ambroise Marie François Joseph Palisot, Baron de Beauvois (27 July 1752, in Arras – 21 January 1820, in Paris) was a French naturalist and zoologist. Palisot collected insects in Oware, Benin, Saint Domingue, and the United States, from 1786 to 1797. Trained as a botanist, Palisot published a significant entomological paper entitled, "Insectes Receuillis en Afrique et en Amerique". Together with Frederick Valentine Melsheimer, he was one of the first entomologists to collect and describe American insects. He described many common insects and suggested an ordinal classification of insects. He described many Scarabaeidae as well as illustrating them for the first time. The study included 39 Scarabaeus species, 17 Copris species, 7 Trox species, 4 Cetonia and 4 Trichius species. Familiar beetles such as Canthon viridis, Macrodactylus angustatus and Osmoderma scabra were first described by him. Many of the specimens that were labelled from America, were from Africa, and vice versa. He created type localities in America for species such as Dynastes hercules (L.), well outside the natural range. Palisot's expeditions were described inter alia by Chase (1925) and Merrill (1937) and a summary is provided here to explain the uncertain origins of his material. Palisot trained as a lawyer but pursued postgraduate studies in botany under Jean-Baptiste Lestiboudois in Lille and Antoine Laurent de Jussieu in Paris. He also did important early work on the classification of lycopods, notably the Lycopodiaceae and Selaginellaceae.
Indicator value is a term that is used in the ecology of plants for two different indices. The older usage of the term refers to Ellenberg's indicator values from 1974, which are based on a simple ordinal classification of plants according to the position of their realized ecological niche along an environmental gradient. Since 1997, the term has also been used to refer to Dufrêne & Legendre's indicator value, which is a quantitative index measuring the statistical alliance of a species to any one of the classes in a classification of sites.
When classification is performed by a computer, statistical methods are normally used to develop the algorithm. Often, the individual observations are analyzed into a set of quantifiable properties, known variously as explanatory variables or features. These properties may variously be categorical (e.g. "A", "B", "AB" or "O", for blood type), ordinal (e.g. "large", "medium" or "small"), integer-valued (e.g. the number of occurrences of a particular word in an email) or real-valued (e.g. a measurement of blood pressure). Other classifiers work by comparing observations to previous observations by means of a similarity or distance function. An algorithm that implements classification, especially in a concrete implementation, is known as a classifier. The term "classifier" sometimes also refers to the mathematical function, implemented by a classification algorithm, that maps input data to a category. Terminology across fields is quite varied. In statistics, where classification is often done with logistic regression or a similar procedure, the properties of observations are termed explanatory variables (or independent variables, regressors, etc.), and the categories to be predicted are known as outcomes, which are considered to be possible values of the dependent variable. In machine learning, the observations are often known as instances, the explanatory variables are termed features (grouped into a feature vector), and the possible categories to be predicted are classes. Other fields may use different terminology: e.g. in community ecology, the term "classification" normally refers to cluster analysis.
Before the 1921 destruction of Tulsa’s Greenwood District, Black residents had created a remarkable center of business and community life. The district included stores, professional offices, entertainment venues and homes owned by Black citizens. Understanding Greenwood means learning what was built—not only what was burned.
MORE →Mae Jemison, aboard Space Shuttle Endeavour in 1992.







![{\displaystyle \log {\mathcal {L}}(\mathbf {w} ,\mathbf {\theta } \mid \mathbf {x} _{i},y_{i})=\sum _{k=1}^{K}[y_{i}=k]\log[\Phi (\theta _{k}-\mathbf {w} \cdot \mathbf {x} _{i})-\Phi (\theta _{k-1}-\mathbf {w} \cdot \mathbf {x} _{i})]}](https://wikimedia.org/api/rest_v1/media/math/render/svg/3abd070e10e43c51b3b8416f6cbc64313a585b5d)