Civil Rights
Movements, leaders, victories and the continuing fight for equality.

Explore the people, places, events, achievements, struggles and stories that shaped our journey.
Movements, leaders, victories and the continuing fight for equality.
Innovation, patents, science, technology and world-changing contributions.
Pioneers, champions, Negro Leagues, records, activism and excellence.
Meet the people whose lives, choices and achievements shaped the journey.
Black towns, communities, institutions and places where history happened.
Moments that changed communities, movements, institutions and the nation.
In August 1908, a white mob attacked Springfield, Illinois’s Black community, destroying homes and businesses and lynching two Black men. National outrage over the violence helped spur the movement that created the NAACP the following year.
MORE →Reflects the personal views, recollections, and perspective of the author, Mike Davis.
This is a personal recollection on the Move fire on May 13, 1985
| This article is part of a series on |
| Competition law |
|---|
 |
In economics, market power refers to the ability of a firm to influence the price at which it sells a product or service by manipulating either the supply or demand of the product or service to increase economic profit.[1] In other words, market power occurs if a firm does not face a perfectly elastic demand curve and can set its price (P) above marginal cost (MC) without losing revenue.[2] This indicates that the magnitude of market power is associated with the gap between P and MC at a firm's profit maximising level of output. The size of the gap, which encapsulates the firm's level of market dominance, is determined by the residual demand curve's form. A steeper reverse demand indicates higher earnings and more dominance in the market.[2] Such propensities contradict perfectly competitive markets, where market participants have no market power, P = MC and firms earn zero economic profit.[3] Market participants in perfectly competitive markets are consequently referred to as 'price takers', whereas market participants that exhibit market power are referred to as 'price makers' or 'price setters'.
The market power of any individual firm is controlled by multiple factors, including but not limited to, their size, the structure of the market they are involved in, and the barriers to entry for the particular market. A firm with market power has the ability to individually affect either the total quantity or price in the market. This said, market power has been seen to exert more upward pressure on prices due to effects relating to Nash equilibria and profitable deviations that can be made by raising prices.[4] Price makers face a downward-sloping demand curve and as a result, price increases lead to a lower quantity demanded. The decrease in supply creates an economic deadweight loss (DWL) and a decline in consumer surplus.[5] This is viewed as socially undesirable and has implications for welfare and resource allocation as larger firms with high markups negatively effect labour markets by providing lower wages.[5] Perfectly competitive markets do not exhibit such issues as firms set prices that reflect costs, which is to the benefit of the customer. As a result, many countries have antitrust or other legislation intended to limit the ability of firms to accrue market power. Such legislation often regulates mergers and sometimes introduces a judicial power to compel divestiture.
Market power provides firms with the ability to engage in unilateral anti-competitive behavior.[6] As a result, legislation recognises that firms with market power can, in some circumstances, damage the competitive process. In particular, firms with market power are accused of limit pricing, predatory pricing, holding excess capacity and strategic bundling.[7] A firm usually has market power by having a high market share although this alone is not sufficient to establish the possession of significant market power. This is because highly concentrated markets may be contestable if there are no barriers to entry or exit. Invariably, this limits the incumbent firm's ability to raise its price above competitive levels.
If no individual participant in the market has significant market power, anti-competitive conduct can only take place through collusion, or the exercise of a group of participants' collective market power.[4] An example of which was seen in 2007, when British Airways was found to have colluded with Virgin Atlantic between 2004 and 2006, increasing their surcharges per ticket from £5 to £60.[8]
Regulators are able to assess the level of market power and dominance a firm has and measure competition through the use of several tools and indicators. Although market power is extremely difficult to measure, through the use of widely used analytical techniques such as concentration ratios, the Herfindahl-Hirschman index and the Lerner index, regulators are able to oversee and attempt to restore market competitiveness.[9]

In economics, market structure can profoundly affect the behavior and financial performance of firms.[10] Market structure depicts how different industries are characterized and differentiated based upon the types of goods the firms sell (homogenous/heterogenous) and the nature of competition within the industry.[11] The degree of market power firms assert in different markets depend on the market structure that the firms operate in. There are four main forms of market structures that are observed: perfect competition, monopolistic competition, oligopoly, and monopoly.[11] Perfect competition and monopoly represent the two extremes of market structure, respectively. Monopolistic competition and oligopoly exist in between these two extremes.[10]
"Perfect Competition" refers to a market structure that is devoid of any barriers or interference and describes those marketplaces where neither corporations nor consumers are powerful enough to affect pricing. In terms of economics, it is one of the many conventional market forms and the optimal condition of market competition.[12] The concept of perfect competition represents a theoretical market structure where the market reaches an equilibrium that is Pareto optimal. This occurs when the quantity supplied by sellers in the market equals the quantity demanded by buyers in the market at the current price.[13] Firms competing in a perfectly competitive market faces a market price that is equal to their marginal cost, therefore, no economic profits are present. The following criteria need to be satisfied in a perfectly competitive market:
As all firms in the market are price takers, they essentially hold zero market power and must accept the price given by the market. A perfectly competitive market is logically impossible to achieve in a real world scenario as it embodies contradiction in itself and therefore is considered an idealised framework by economists.[14]
Monopolistic competition can be described as the "middle ground" between perfect competition and a monopoly as it shares elements present in both market structures that are on different ends of the market structure spectrum.[15] Monopolistic competition is a type of market structure defined by many producers that are competing against each other by selling similar goods which are differentiated, thus are not perfect substitutes.[16] In the short term, firms are able to obtain economic profits as a result of differentiated goods providing sellers with some degree of market power; however, profits approaches zero as more competitive toughness increases in the industry.[17] The main characteristics of monopolistic competition include:
Firms within this market structure are not price takers and compete based on product price, quality and through marketing efforts, setting individual prices for the unique differentiated products.[18] Examples of industries with monopolistic competition include restaurants, hairdressers and clothing.
The word monopoly is used in various instances referring to a single seller of a product, a producer with an overwhelming level of market share, or refer to a large firm.[19] All of these treatments have one unifying factor which is the ability to influence the market price by altering the supply of the good or service through its own production decisions. The most discussed form of market power is that of a monopoly, but other forms such as monopsony and more moderate versions of these extremes exist. A monopoly is considered a 'market failure' and consists of one firm that produces a unique product or service without close substitutes. Whilst pure monopolies are rare, monopoly power is far more common and can be seen in many industries even with more than one supplier in the market.[20] Firms with monopoly power can charge a higher price for products (higher markup) as demand is relatively inelastic.[21] They also see a falling rate of labour share as firms divest from expensive inputs such as labour.[22] Often, firms with monopoly power exist in industries with high barriers to entry, which include, but are not limited to:
A well-known example of monopolistic market power is Microsoft's market share in PC operating systems. The United States v. Microsoft case dealt with an allegation that Microsoft illegally exercised its market power by bundling its web browser with its operating system. In this respect, the notion of dominance and dominant position in EU Antitrust Law is a strictly related aspect.[23]
Another form of market power is that of an oligopoly or oligopsony. Within this market structure, the market is highly concentrated and several firms control a significant share of market sales.[24] The emergence of oligopoly market forms is mainly attributed to the monopoly of market competition, i.e., the market monopoly acquired by enterprises through their competitive advantages, and the administrative monopoly due to government regulations, such as when the government grants monopoly power to an enterprise in the industry through laws and regulations and at the same time imposes certain controls on it to improve efficiency.[25] The main characteristics of an oligopoly are:
It is salient to note that only a few firms make up the market share. Hence, their market power is large as a collective and each firm has little or no market power independently.[27] For firms trying to enter these industries, unless they can start with a large production scale and capture a significant market share, the high average costs will make it impossible for them to compete with the existing firms.[28] Generally, when a firm operating in an oligopolistic market adjusts prices, other firms in the industry will be directly impacted.
The graph below depicts the kinked demand curve hypothesis which was proposed by Paul Sweezy who was an American economist.[29] This graph is a simplistic example of a kinked demand curve.

Oligopolistic firms are believed to operate within the confines of the kinked demand function. This means that when firms set prices above the prevailing price level (P*), prices are relatively elastic because individuals are likely to switch to a competitor's product as a substitute. Prices below P* are believed to be relatively inelastic as competitive firms are likely to mimic the change in prices, meaning less gains are experienced by the firm.[30]
An oligopoly may engage in collusion, either tacit or overt to exercise market power and manipulate prices to control demand and revenue for a collection of firms. A group of firms that explicitly agree to affect market price or output is called a cartel, with the organization of petroleum-exporting countries (OPEC) being one of the most well known example of an international cartel.
By remaining consistent with the strict definition of market power as any firm with a positive Lerner index, the sources of market power is derived from distinctiveness of the good and or seller.[31] For a monopolist, distinctiveness is a necessary condition that needs to be satisfied but this is just the starting point. Without barriers to entries, above normal profits experienced by monopolists would not persist as other sellers of homogenous or similar goods would continue to enter the industry until above normal profits are diminished until the industry experiences perfect competition[31]
There are several sources of market power including:
Measuring market power is inherently complex because the most widely used measures are sensitive to the definition of a market and the range of analysis.
Magnitude of a firm's market power is shown by a firm's ability to deviate from an elastic demand curve and charge a higher price (P) above its marginal cost (C), commonly referred to as a firm's markup.[35] The higher a firm's markup, the larger the magnitude of power. This said, markups are complicated to measure as they are reliant on a firm's marginal costs and as a result, concentration ratios are the more common measures as they require only publicly accessible revenue data.
Market concentration, also referred to as industry concentration, refers to the extent of which market shares of the largest firms in the market account for a significant portion of the economic activities quantifiable by various metrics such as sales, employment, active users.[36] Recent macroeconomic market power literature indicates that concentration ratios are the most frequently used measure of market power.[2] Measures of concentration summarise the share of market or industry activity accounted for by large firms. An advantage of using concentration as an empirical tool to quantify market power is the requirement of only needing revenue data of firms which results in the corresponding disadvantage of the inconsideration of costs or profits.[35]
The N-firm concentration ratio gives the combined market share of the largest N firms in the market. For example, a 4-firm concentration ratio measures the total market share of the four largest firms in an industry. In order to calculate the N-firm concentration ratio, one usually uses sales revenue to calculate market share, however, concentration ratios based on other measures such as production capacity may also be used. For a monopoly, the 4-firm concentration ratio is 100 per cent whilst for perfect competition, the ratio is zero.[37] Moreover, studies indicate that a concentration ratio of between 40 and 70 percent suggests that the firm operates as an oligopoly.[38] These figures are viable but should be used as a 'rule of thumb' as it is important to consider other market factors when analysing concentration ratios.
An advantage of concentration ratios as an empirical tool for studying market power is that it requires only data on revenues and is thus easy to compute. The corresponding disadvantage is that concentration is about relative revenue and includes no information about costs or profits.
The Herfindahl-Hirschman index (HHI) is another measure of concentration and is the sum of the squared market shares of all firms in a market.[39] The HHI is a more widely used indicator in economics and government regulation. The index reflects not only the market share of large firms within the market, but also the market structure outside of large firms, and therefore, more accurately reflects the degree of influence of large firms on the market.[40] For example, in a market with two firms, each with 50% market share, the HHI is = 0.502 + 0.502 = 0.50. The HHI for a monopoly is 1 whilst for perfect competition, the HHI is zero. Unlike the N-firm concentration ratio, large firms are given more weight in the HHI and as a result, the HHI conveys more information. However the HHI has its own limitations as it is sensitive to the definition of a market, therefore meaning you cannot use it to cross-examine different industries, or do analysis over time as the industry changes.[22]

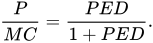
The Lerner index is a widely accepted and applied method of estimating market power in a monopoly. It compares a firm's price of output with its associated marginal cost where marginal cost pricing is the "socially optimal level" achieved in market with perfect competition.[41] Lerner (1934) believes that market power is the monopoly manufacturers' ability to raise prices above their marginal cost.[42] This notion can be expressed by using the formula:
Where P represents the price of the good set by the firm and MC representing the firm's marginal cost. The formula focuses on the nature of monopoly and emphasising welfare economic implications of the Pareto optimal principle.[43] Although Lerner is usually credited for the price/cost margin index, the generalized version was fully derived prior to WWII by Italian neoclassical economist, Luigi Amaroso.[44]
Market power within competition law can be used to determine whether or not a firm has unfairly manipulated the market in their favour, or to the detriment of entrants. The Sherman Antitrust Act of 1890 under section 2 restricts firms from engaging in anticompetitive conduct by utilising an individual firm's power to manipulate the market or partake in anticompetitive acts.[45] A firm can be found in breach of the act if they have leveraged their market power to unfairly gain further market power in a manner that is detrimental to the market and consumers. The measurement of market power is key in determining a breach of the act and can be determined from multiple measurements as discussed in measurements of market power above.
In Australia, consumer law allows for firms to have significant market power and utilise it, as long as it is determined to not have "the purpose, effect or likely effect of substantially lessening competition" [46]
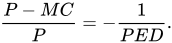
The degree to which a firm can raise its price above marginal cost depends on the shape of the demand curve at a firm's profit maximising level of output.[47] Consequently, the relationship between market power and the price elasticity of demand (PED) can be summarised by the equation:
The ratio is always greater than 1 and the higher the ratio, the more market power the firm possesses. As PED increases in magnitude, the ratio approaches 1 and market power approaches zero. The equation is derived from the monopolist pricing rule:
Jean Tirole was awarded the 2014 Nobel Memorial Prize in Economic Sciences for his analysis of market power and economic regulation.[48]
{{cite book}}: CS1 maint: location missing publisher (link)
{{cite book}}: ISBN / Date incompatibility (help)
{{cite book}}: CS1 maint: location missing publisher (link)
| International | |
|---|---|
| National | |
Source: Wikipedia. Article content is retrieved live through the MediaWiki API.
In economics, market power refers to the ability of a firm to influence the price at which it sells a product or service by manipulating either the supply or demand of the product or service to increase economic profit. In other words, market power occurs if a firm does not face a perfectly elastic demand curve and can set its price (P) above marginal cost (MC) without losing revenue. This indicates that the magnitude of market power is associated with the gap between P and MC at a firm's profit maximising level of output. The size of the gap, which encapsulates the firm's level of market dominance, is determined by the residual demand curve's form. A steeper reverse demand indicates higher earnings and more dominance in the market. Such propensities contradict perfectly competitive markets, where market participants have no market power, P = MC and firms earn zero economic profit. Market participants in perfectly competitive markets are consequently referred to as 'price takers', whereas market participants that exhibit market power are referred to as 'price makers' or 'price setters'. The market power of any individual firm is controlled by multiple factors, including but not limited to, their size, the structure of the market they are involved in, and the barriers to entry for the particular market. A firm with market power has the ability to individually affect either the total quantity or price in the market. This said, market power has been seen to exert more upward pressure on prices due to effects relating to Nash equilibria and profitable deviations that can be made by raising prices. Price makers face a downward-sloping demand curve and as a result, price increases lead to a lower quantity demanded. The decrease in supply creates an economic deadweight loss (DWL) and a decline in consumer surplus. This is viewed as socially undesirable and has implications for welfare and resource allocation as larger firms with high markups negatively effect labour markets by providing lower wages. Perfectly competitive markets do not exhibit such issues as firms set prices that reflect costs, which is to the benefit of the customer. As a result, many countries have antitrust or other legislation intended to limit the ability of firms to accrue market power. Such legislation often regulates mergers and sometimes introduces a judicial power to compel divestiture. Market power provides firms with the ability to engage in unilateral anti-competitive behavior. As a result, legislation recognises that firms with market power can, in some circumstances, damage the competitive process. In particular, firms with market power are accused of limit pricing, predatory pricing, holding excess capacity and strategic bundling. A firm usually has market power by having a high market share although this alone is not sufficient to establish the possession of significant market power. This is because highly concentrated markets may be contestable if there are no barriers to entry or exit. Invariably, this limits the incumbent firm's ability to raise its price above competitive levels. If no individual participant in the market has significant market power, anti-competitive conduct can only take place through collusion, or the exercise of a group of participants' collective market power. An example of which was seen in 2007, when British Airways was found to have colluded with Virgin Atlantic between 2004 and 2006, increasing their surcharges per ticket from £5 to £60. Regulators are able to assess the level of market power and dominance a firm has and measure competition through the use of several tools and indicators. Although market power is extremely difficult to measure, through the use of widely used analytical techniques such as concentration ratios, the Herfindahl-Hirschman index and the Lerner index, regulators are able to oversee and attempt to restore market competitiveness.

A price in economics is the amount of money that buyers are willing and able to pay for a particular good or service, and that sellers are willing to accept. In some situations, especially when the product is a service rather than a physical good, the price for the service may be called something else such as "rent" or "tuition". Prices are influenced by production costs, supply of the desired product, and demand for the product. A price may be determined by a monopolist or may be imposed on the firm by market conditions. Prices are usually non-negative. Price can be quoted in currency, quantities of goods or vouchers. In modern economies, prices are generally expressed in units of some form of currency. (More specifically, for raw materials they are expressed as currency per unit weight, e.g. euros per kilogram or Rands per KG.) Although prices could be quoted as quantities of other goods or services, this sort of barter exchange is rarely seen. Prices are sometimes quoted in terms of vouchers such as trading stamps and air miles. In some circumstances, cigarettes have been used as currency, for example in prisons, in times of hyperinflation, and in some places during World War II. In a black market economy, barter is also relatively common. In many financial transactions, it is customary to quote prices in other ways. The most obvious example is in pricing a loan, when the cost will be expressed as the percentage rate of interest. The total amount of interest payable depends upon credit risk, the loan amount and the period of the loan. Other examples can be found in pricing financial derivatives and other financial assets. For instance the price of inflation-linked government securities in several countries is quoted as the actual price divided by a factor representing inflation since the security was issued. "Price" sometimes refers to the quantity of payment requested by a seller of goods or services, rather than the eventual payment amount. In business this requested amount is often referred to as the offer price (or selling price), while the actual payment may be called transaction price (or traded price). Economic price theory asserts that in a free market economy the market price reflects the interaction between supply and demand: the price is set so as to equate the quantity being supplied and that being demanded. In turn, these quantities are determined by the marginal utility of the asset to different buyers and to different sellers. Supply and demand, and hence price, may be influenced by other factors, such as government subsidy or manipulation through industry collusion. When a raw material or a similar economic good is for sale at multiple locations, the law of one price is generally believed to hold. This essentially states that the cost difference between the locations cannot be greater than that representing shipping, taxes, other distribution costs and more money

The Price Is Right is an American television game show. A 1972 revival by Mark Goodson and Bill Todman of their 1956–1965 show of the same name, the new version adds many distinctive gameplay elements. Contestants compete in a variety of games to determine the prices of products or prizes which they may win. These contestants are selected from the studio audience and are called onstage to compete by the announcer using the show's catchphrase of "come on down!" The program premiered September 4, 1972, on CBS. Bob Barker was the series's longest-running host from its debut until his retirement in June 2007, when Drew Carey took over. Johnny Olson was the show's original announcer, holding this role until just before his death in 1985. He was replaced by Rod Roddy, who remained with the show until just before his own death in late 2003. Rich Fields took over as announcer in 2004 and was replaced with George Gray in 2011. The show has featured numerous models as prize presenters, most notably Anitra Ford, Janice Pennington, Dian Parkinson, Holly Hallstrom, and Kathleen Bradley. The Price Is Right has aired over 10,000 episodes since its debut. It is the longest-running game show in the United States and is one of the longest-running network series in United States television history. The 53rd season premiered on September 23, 2024, with both a daytime and primetime episode, and its 10,000th episode aired on February 26, 2025. On March 2, 2022, it was announced that The Price Is Right would be inducted into the NAB Broadcasting Hall of Fame. Host Drew Carey and executive producer Evelyn Warfel accepted the award at The Achievement in Broadcasting Awards on the NAB Show main stage in Las Vegas on April 24, 2022. Beginning with season 54, which premiered in September 2025, The Price Is Right became the longest running game show in the world, surpassing the Chilean variety show Sábado Gigante, which aired 53 seasons from 1962 until 2015. Season 55 premiered on September 21, 2026, marking the 20th season with Carey as host.

Price discrimination, known also by several other names, is a microeconomic pricing strategy whereby identical or largely similar goods or services are sold at different prices by the same provider to different buyers, based on which market segment they are perceived to be part of. Price discrimination is distinguished from product differentiation by the difference in production cost for the differently priced products involved in the latter strategy. Price discrimination essentially relies on the variation in customers' willingness to pay and in the elasticity of their demand. For price discrimination to succeed, a seller must have market power, such as a dominant market share, product uniqueness, sole pricing power, etc. Some prices under price discrimination may be lower than the price charged by a single-price monopolist. Price discrimination can be utilized by a monopolist to recapture some deadweight loss. This pricing strategy enables sellers to capture additional consumer surplus and maximize their profits while offering some consumers lower prices. Price discrimination can take many forms and is common in many industries, such as travel, education, telecommunications, and healthcare.
Before the 1921 destruction of Tulsa’s Greenwood District, Black residents had created a remarkable center of business and community life. The district included stores, professional offices, entertainment venues and homes owned by Black citizens. Understanding Greenwood means learning what was built—not only what was burned.
MORE →Madam C.J. Walker