Civil Rights
Movements, leaders, victories and the continuing fight for equality.

Explore the people, places, events, achievements, struggles and stories that shaped our journey.
Movements, leaders, victories and the continuing fight for equality.
Innovation, patents, science, technology and world-changing contributions.
Pioneers, champions, Negro Leagues, records, activism and excellence.
Meet the people whose lives, choices and achievements shaped the journey.
Black towns, communities, institutions and places where history happened.
Moments that changed communities, movements, institutions and the nation.
Katherine Johnson’s mathematical calculations helped guide some of America’s most important early space missions while she confronted the racial and gender barriers faced by Black women in twentieth-century America.
MORE →Reflects the personal views, recollections, and perspective of the author, Mike Davis.
This is a personal recollection on the Move fire on May 13, 1985
| Statistics |
|---|
 |
The root mean square deviation (RMSD) or root mean square error (RMSE) is a frequently used measure of the distances between actual observed values and an estimation of them (e.g. true/predicted in regression tasks of Machine learning). The deviation is typically simply a differences of scalars; it can also be generalized to the vector lengths of a displacement, as in the bioinformatics concept of root mean square deviation of atomic positions.
The RMSD of a sample is the quadratic mean of the differences between the observed values and predicted ones. These deviations are called residuals when the calculations are performed over the data sample that was used for estimation (and are therefore always in reference to an estimate) and are called errors (or prediction errors) when computed out-of-sample (aka on the full set, referencing a true value rather than an estimate). The RMSD serves to aggregate the magnitudes of the errors in predictions for various data points into a single measure of predictive power. RMSD is a measure of accuracy, to compare forecasting errors of different models for a particular dataset and not between datasets, as it is scale-dependent.[1]
RMSD is always non-negative, and a value of 0 (almost never achieved in practice) would indicate a perfect fit to the data. In general, a lower RMSD is better than a higher one. However, comparisons across different types of data would be invalid because the measure is dependent on the scale of the numbers used.
RMSD is the square root of the average of squared errors. The effect of each error on RMSD is proportional to the size of the squared error; thus larger errors have a disproportionately large effect on RMSD. Consequently, RMSD is sensitive to outliers.[2][3]
The RMSD of an estimator with respect to an estimated parameter is defined as the square root of the mean squared error:
For an unbiased estimator, the RMSD is the square root of the variance, known as the standard deviation.
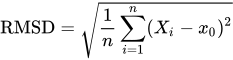
If X1, ..., Xn is a sample of a population with true mean value , then the RMSD of the sample is
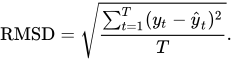
The RMSD of predicted values for times t of a regression's dependent variable with variables observed over T times, is computed for T different predictions as the square root of the mean of the squares of the deviations:
(For regressions on cross-sectional data, the subscript t is replaced by i and T is replaced by n.)
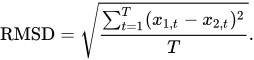
In some disciplines, the RMSD is used to compare differences between two things that may vary, neither of which is accepted as the "standard". For example, when measuring the average difference between two time series and , the formula becomes
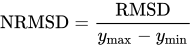
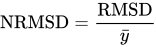
Normalizing the RMSD facilitates the comparison between datasets or models with different scales. Though there is no consistent means of normalization in the literature, common choices are the mean or the range (defined as the maximum value minus the minimum value) of the measured data:[4]
This value is commonly referred to as the normalized root mean square deviation or error (NRMSD or NRMSE), and often expressed as a percentage, where lower values indicate less residual variance. This is also called Coefficient of Variation or Percent RMS. In many cases, especially for smaller samples, the sample range is likely to be affected by the size of sample which would hamper comparisons.
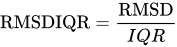
Another possible method to make the RMSD a more useful comparison measure is to divide the RMSD by the interquartile range (IQR). When dividing the RMSD with the IQR the normalized value gets less sensitive for extreme values in the target variable.
with and where CDF−1 is the quantile function.
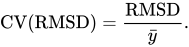
When normalizing by the mean value of the measurements, the term coefficient of variation of the RMSD, CV(RMSD) may be used to avoid ambiguity.[5] This is analogous to the coefficient of variation with the RMSD taking the place of the standard deviation.
{{cite journal}}: Cite uses deprecated parameter |citeseerx= (help)
{{cite journal}}: Cite uses deprecated parameter |citeseerx= (help)
Source: Wikipedia. Article content is retrieved live through the MediaWiki API.
The root mean square deviation (RMSD) or root mean square error (RMSE) is a frequently used measure of the distances between actual observed values and an estimation of them (e.g. true/predicted in regression tasks of Machine learning). The deviation is typically simply a differences of scalars; it can also be generalized to the vector lengths of a displacement, as in the bioinformatics concept of root mean square deviation of atomic positions.
In statistics, the mean squared error (MSE) or mean squared deviation (MSD) of an estimator (of a procedure for estimating an unobserved quantity) measures the average of the squares of the errors—that is, the average squared difference between the estimated values and the true value. MSE is a risk function, corresponding to the expected value of the squared error loss. The fact that MSE is almost always strictly positive (and not zero) is because of randomness or because the estimator does not account for information that could produce a more accurate estimate. In machine learning, specifically empirical risk minimization, MSE may refer to the empirical risk (the average loss on an observed data set), as an estimate of the true MSE (the true risk: the average loss on the actual population distribution). The MSE is a measure of the quality of an estimator. As it is derived from the square of Euclidean distance, it is always a positive value that decreases as the error approaches zero. The MSE is the second moment (about the origin) of the error, and thus incorporates both the variance of the estimator (how widely spread the estimates are from one data sample to another) and its bias (how far off the average estimated value is from the true value). For an unbiased estimator, the MSE is the variance of the estimator. Like the variance, MSE has the same units of measurement as the square of the quantity being estimated. In an analogy to standard deviation, taking the square root of MSE yields the root-mean-square error or root-mean-square deviation (RMSE or RMSD), which has the same units as the quantity being estimated; for an unbiased estimator, the RMSE is the square root of the variance, known as the standard error.
An Error Metric is a type of Metric used to measure the error of a forecasting model. They can provide a way for forecasters to quantitatively compare the performance of competing models. Some common error metrics are: Mean Squared Error (MSE) Root Mean Square Error (RMSE) Mean absolute error (MAE) Mean Absolute Scaled Error (MASE) Mean Absolute Percentage Error (MAPE) Symmetric Mean Absolute Percentage Error (SMAPE)
In numerical analysis, the Kahan summation algorithm, also known as compensated summation, significantly reduces the numerical error in the total obtained by adding a sequence of finite-precision floating-point numbers, compared to the naive approach (a summation algorithm). This is done by keeping a separate running compensation (a variable to accumulate small errors), in effect extending the precision of the sum by the precision of the compensation variable. In particular, simply summing n {\displaystyle n} numbers in sequence has a worst-case error that grows proportional to n {\displaystyle n} , and a root mean square error that grows as n {\displaystyle {\sqrt {n}}} for random inputs (the roundoff errors form a random walk). With compensated summation, using a compensation variable with sufficiently high precision the worst-case error bound is effectively independent of n {\displaystyle n} , so a large number of values can be summed with an error that only depends on the floating-point precision of the result. The algorithm is attributed to William Kahan; Ivo Babuška seems to have come up with a similar algorithm independently (hence Kahan–Babuška summation). Similar, earlier techniques are, for example, Bresenham's line algorithm, keeping track of the accumulated error in integer operations (although first documented around the same time) and the delta-sigma modulation.
Before the 1921 destruction of Tulsa’s Greenwood District, Black residents had created a remarkable center of business and community life. The district included stores, professional offices, entertainment venues and homes owned by Black citizens. Understanding Greenwood means learning what was built—not only what was burned.
MORE →Mae Jemison, aboard Space Shuttle Endeavour in 1992.