Civil Rights
Movements, leaders, victories and the continuing fight for equality.

Explore the people, places, events, achievements, struggles and stories that shaped our journey.
Movements, leaders, victories and the continuing fight for equality.
Innovation, patents, science, technology and world-changing contributions.
Pioneers, champions, Negro Leagues, records, activism and excellence.
Meet the people whose lives, choices and achievements shaped the journey.
Black towns, communities, institutions and places where history happened.
Moments that changed communities, movements, institutions and the nation.
In August 1908, a white mob attacked Springfield, Illinois’s Black community, destroying homes and businesses and lynching two Black men. National outrage over the violence helped spur the movement that created the NAACP the following year.
MORE →Reflects the personal views, recollections, and perspective of the author, Mike Davis.
This is a personal recollection on the Move fire on May 13, 1985
In statistics, adaptive or "variable-bandwidth" kernel density estimation is a form of kernel density estimation in which the size of the kernels used in the estimate are varied depending upon either the location of the samples or the location of the test point. It is a particularly effective technique when the sample space is multi-dimensional. [1]
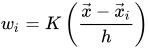
Given a set of samples, , we wish to estimate the density, , at a test point, :
where n is the number of samples, K is the "kernel", h is its width and D is the number of dimensions in . The kernel can be thought of as a simple, linear filter.
Using a fixed filter width may mean that in regions of low density, all samples will fall in the tails of the filter with very low weighting, while regions of high density will find an excessive number of samples in the central region with weighting close to unity. To fix this problem, we vary the width of the kernel in different regions of the sample space. There are two methods of doing this: balloon and pointwise estimation. In a balloon estimator, the kernel width is varied depending on the location of the test point. In a pointwise estimator, the kernel width is varied depending on the location of the sample.[1]
For multivariate estimators, the parameter, h, can be generalized to vary not just the size, but also the shape of the kernel. This more complicated approach will not be covered here.
A common method of varying the kernel width is to make it inversely proportional to the density at the test point:
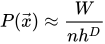
where k is a constant. If we back-substitute the estimated PDF, and assuming a Gaussian kernel function, we can show that W is a constant:[2]
A similar derivation holds for any kernel whose normalising function is of the order hD, although with a different constant factor in place of the (2 π)D/2 term. This produces a generalization of the k-nearest neighbour algorithm. That is, a uniform kernel function will return the KNN technique.[2]
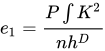
There are two components to the error: a variance term and a bias term. The variance term is given as:[1]
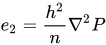
The bias term is found by evaluating the approximated function in the limit as the kernel width becomes much larger than the sample spacing. By using a Taylor expansion for the real function, the bias term drops out:
An optimal kernel width that minimizes the error of each estimate can thus be derived.
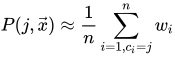
The method is particularly effective when applied to statistical classification. There are two ways we can proceed: the first is to compute the PDFs of each class separately, using different bandwidth parameters, and then compare them as in Taylor.[3] Alternatively, we can divide up the sum based on the class of each sample:
where ci is the class of the ith sample. The class of the test point may be estimated through maximum likelihood.
Source: Wikipedia. Article content is retrieved live through the MediaWiki API.
In statistics, adaptive or "variable-bandwidth" kernel density estimation is a form of kernel density estimation in which the size of the kernels used in the estimate are varied depending upon either the location of the samples or the location of the test point. It is a particularly effective technique when the sample space is multi-dimensional.

In statistics, kernel density estimation (KDE) is the application of kernel smoothing for probability density estimation, i.e., a non-parametric method to estimate the probability density function of a random variable based on kernels as weights. KDE answers a fundamental data smoothing problem where inferences about the population are made based on a finite data sample. In some fields such as signal processing and econometrics it is also termed the Parzen–Rosenblatt window method, after Emanuel Parzen and Murray Rosenblatt, who are usually credited with independently creating it in its current form. One of the famous applications of kernel density estimation is in estimating the class-conditional marginal densities of data when using a naive Bayes classifier, which can improve its prediction accuracy.
Kernel density estimation is a nonparametric technique for density estimation i.e., estimation of probability density functions, which is one of the fundamental questions in statistics. It can be viewed as a generalisation of histogram density estimation with improved statistical properties. Apart from histograms, other types of density estimators include parametric, spline, wavelet and Fourier series. Kernel density estimators were first introduced in the scientific literature for univariate data in the 1950s and 1960s and subsequently have been widely adopted. It was soon recognised that analogous estimators for multivariate data would be an important addition to multivariate statistics. Based on research carried out in the 1990s and 2000s, multivariate kernel density estimation has reached a level of maturity comparable to its univariate counterparts.
In machine learning, the kernel embedding of distributions (also called the kernel mean or mean map) comprises a class of nonparametric methods in which a probability distribution is represented as an element of a reproducing kernel Hilbert space (RKHS). A generalization of the individual data-point feature mapping done in classical kernel methods, the embedding of distributions into infinite-dimensional feature spaces can preserve all of the statistical features of arbitrary distributions, while allowing one to compare and manipulate distributions using Hilbert space operations such as inner products, distances, projections, linear transformations, and spectral analysis. This learning framework is very general and can be applied to distributions over any space Ω {\displaystyle \Omega } on which a sensible kernel function (measuring similarity between elements of Ω {\displaystyle \Omega } ) may be defined. For example, various kernels have been proposed for learning from data which are: vectors in R d {\displaystyle \mathbb {R} ^{d}} , discrete classes/categories, strings, graphs/networks, images, time series, manifolds, dynamical systems, and other structured objects. The theory behind kernel embeddings of distributions has been primarily developed by Alex Smola, Le Song, Arthur Gretton, and Bernhard Schölkopf. A review of recent works on kernel embedding of distributions can be found in. The analysis of distributions is fundamental in machine learning and statistics, and many algorithms in these fields rely on information theoretic approaches such as entropy, mutual information, or Kullback–Leibler divergence. However, to estimate these quantities, one must first either perform density estimation, or employ sophisticated space-partitioning/bias-correction strategies which are typically infeasible for high-dimensional data. Commonly, methods for modeling complex distributions rely on parametric assumptions that may be unfounded or computationally challenging (e.g. Gaussian mixture models), while nonparametric methods like kernel density estimation (Note: the smoothing kernels in this context have a different interpretation than the kernels discussed here) or characteristic function representation (via the Fourier transform of the distribution) break down in high-dimensional settings. Methods based on the kernel embedding of distributions sidestep these problems and also possess the following advantages: Data may be modeled without restrictive assumptions about the form of the distributions and relationships between variables Intermediate density estimation is not needed Practitioners may specify the properties of a distribution most relevant for their problem (incorporating prior knowledge via choice of the kernel) If a characteristic kernel is used, then the embedding can uniquely preserve all information about a distribution, thanks to the kernel trick, while computations on the potentially infinite-dimensional RKHS can be implemented in practice as simple Gram matrix operations Dimensionality-independent rates of convergence for the empirical kernel mean (estimated using samples from the distribution) to the kernel embedding of the true underlying distribution can be proven. Learning algorithms based on this framework exhibit good generalization ability and finite sample convergence, while often being simpler and more effective than information theoretic methods Thus, learning via the kernel embedding of distributions offers a principled drop-in replacement for information theoretic approaches and is a framework which not only subsumes many popular methods in machine learning and statistics as special cases, but also can lead to entirely new learning algorithms.
Before the 1921 destruction of Tulsa’s Greenwood District, Black residents had created a remarkable center of business and community life. The district included stores, professional offices, entertainment venues and homes owned by Black citizens. Understanding Greenwood means learning what was built—not only what was burned.
MORE →Joe Louis.



![{\displaystyle h={\frac {k}{\left[nP({\vec {x}})\right]^{1/D}}}}](https://wikimedia.org/api/rest_v1/media/math/render/svg/cfd56ccdb9576206d4d0198d71d59398728009a2)